3D plots are great when 2D just isn’t enough—especially for visualizing spatial relationships, directions, and vector interactions. This example shows how to draw multiple 3D vectors as arrows (shaft + arrowhead) using createVectors3D, then render them in a single plot.
What you’ll get
-
A 3D figure with several vectors starting from different points
-
Customizable arrow appearance (color, width, head scale, head angle)
-
Explicit axis labels and bounds (
xlim/ylim/zlim) for a clean view
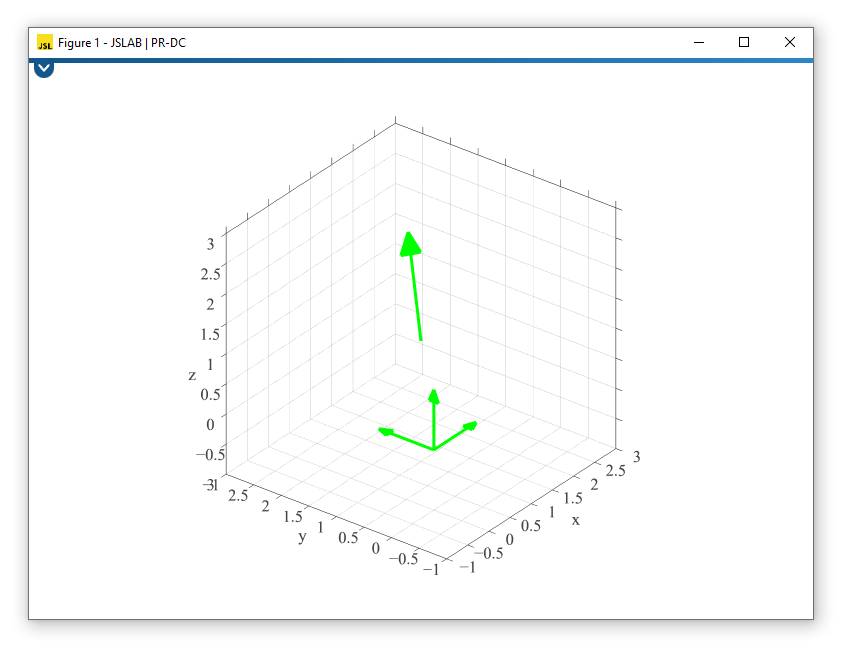
Example: 3D Plot with Vectors
// 3D Plot with Vectors

var x = [0, 0, 0, 1, 0];
var y = [0, 0, 0, 1, 0];
var z = [0, 0, 0, 1, 0];

var u = [1, 0, 0, 1, -1];
var v = [0, 1, 0, 1, 0];
var w = [0, 0, 1, 1, 0];

var head_scale = 0.2;
var head_angleFactor = 0.4;

// Build arrow geometry (shaft + head)
var vectors = createVectors3D(
  x, y, z,
  u, v, w,
  head_scale,
  head_angleFactor,
  { color: "#0f0", width: 6 }
);

figure(1);

// Plot both the vector lines and arrow heads
plot([
  vectors.line,
  vectors.head
], {
  showLegend: false,
  font: { family: "LatinModern", size: 14 }
});

xlabel("x");
ylabel("y");
zlabel("z");

xlim([-1, 3]);
ylim([-1, 3]);
zlim([-1, 3]);
How it works (quick explanation)
-
(x, y, z)defines the starting points of each vector. -
(u, v, w)defines the direction and magnitude of each vector (end = start + direction). -
createVectors3D(...)returns two drawable objects:-
vectors.line→ the vector shafts -
vectors.head→ the arrowheads
-
Customization ideas
-
Make different groups of vectors different colors (call
createVectors3Dmultiple times). -
Scale vector lengths (multiply
u/v/w) to normalize or exaggerate magnitudes. -
Increase
head_scalefor larger arrowheads, tweakhead_angleFactorfor sharper/wider tips.